HTTP load tests
We measured throughput, latency, memory, and connection recovery using Nagi's HTTP sample. The initial tests ran on October 1, 2026, using Nagi 0.1.2 at commit c602abb. The implementation with a request-wait deadline is compared separately in the follow-up tests.
The endpoint that receives a 4 KiB string and returns JSON handled 15,000 requests per second for 30 minutes. All 27,000,270 requests returned HTTP 200. However, connection counts and memory increased, and file descriptors remained after the load stopped. Throughput alone does not establish stability.
All traffic stayed on the same machine. These results do not establish internet throughput, DDoS resistance, or stability over 24 hours or longer.
On this page
Reading the numbers
- Requested rate: the number of requests per second requested from the load generator.
- Dispatched rate: the rate the client actually sent. It can fall below the requested rate when the client is overloaded.
- Successful rate: successful requests per second, including the final response wait.
- p99: 99% of dispatched requests finished within this time. It excludes waiting for arrivals that the client could not send.
- RSS: the server's resident memory. File descriptors (FDs) are OS resources used for connections and other handles.
Increasing the load
| Workload | Requested/s | Dispatched/s | Successful/s | p99 | Errors (3 trials) |
|---|---|---|---|---|---|
| HTTP /health | 10,000 | 10,000 | 10,000 | 2.03ms | 0 |
| HTTP /health | 30,000 | 29,960 | 29,874 | 190.36ms | 0 |
| HTTP /health | 60,000 | 31,990 | 31,739 | 264.83ms | 0 |
| HTTP /health | 100,000 | 32,501 | 32,266 | 301.05ms | 0 |
| 4KiB JSON | 5,000 | 5,000 | 4,999 | 0.83ms | 0 |
| 4KiB JSON | 10,000 | 10,000 | 10,000 | 2.12ms | 0 |
| 4KiB JSON | 15,000 | 15,000 | 15,000 | 5.24ms | 0 |
| 4KiB JSON | 20,000 | 19,997 | 19,993 | 144.35ms | 0 |
| 4KiB JSON | 30,000 | 27,471 | 27,216 | 310.65ms | 0 |
| 4KiB JSON | 50,000 | 27,700 | 27,483 | 261.35ms | 0 |
| SQLite SELECT | 5,000 | 5,000 | 4,999 | 0.64ms | 0 |
| SQLite SELECT | 10,000 | 10,000 | 10,000 | 1.46ms | 0 |
| SQLite SELECT | 20,000 | 19,999 | 19,998 | 6.06ms | 0 |
| SQLite SELECT | 40,000 | 32,174 | 31,939 | 222.11ms | 0 |
| SQLite INSERT | 1,000 | 1,000 | 1,000 | 0.39ms | 0 |
| SQLite INSERT | 5,000 | 4,999 | 4,999 | 0.83ms | 0 |
| SQLite INSERT | 10,000 | 10,000 | 10,000 | 1.64ms | 0 |
| SQLite INSERT | 20,000 | 20,000 | 19,998 | 32.96ms | 0 |
Each row is the median of three 8-second trials. The p99 is the median of each trial's p99, not a pooled percentile. Vegeta's percentiles are approximate aggregates. SQLite used an in-memory database. Reads selected the same row; writes kept inserting rows.
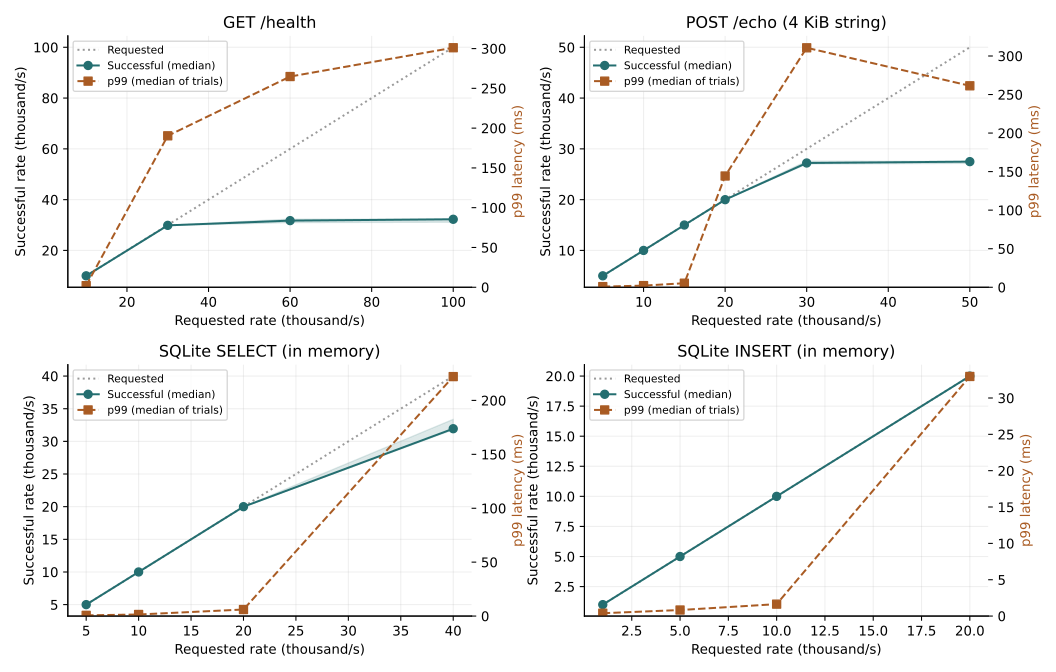
When the load generator exhausted its CPU capacity, a higher requested rate did not produce more traffic. The first consecutive sweep also exhausted client source ports. We retained that initial sweep, and the main table uses a repeat with a distinct loopback source address for each trial. All 12,177 failures in the initial sweep were client-side bind: address already in use errors.
Fixed-concurrency saturation test
We also increased connection counts using wrk, which places less overhead on the client. This client sends another request after receiving a response.
| Workload | Connections | Responses/s | p99 | CPU (% of one core) | Errors |
|---|---|---|---|---|---|
| HTTP /health | 128 | 77,689 | 2.73ms | 99.7% | 0 |
| HTTP /health | 512 | 70,682 | 69.85ms | 99.2% | 0 |
| HTTP /health | 2,048 | 66,528 | 375.86ms | 97.6% | 0 |
| 4KiB JSON | 128 | 39,022 | 4.75ms | 96.9% | 0 |
| 4KiB JSON | 512 | 39,322 | 70.93ms | 99.1% | 0 |
| 4KiB JSON | 2,048 | 38,344 | 386.19ms | 96.5% | 0 |
Values are medians of three 8-second trials. This closed-loop test excludes the latency of arrivals waiting to be sent. Treat it separately from the paced load test above.
Receiving traffic for 30 minutes
| Condition | 30 minutes, unrestricted client connections | 10 minutes, client capped at 128 connections |
|---|---|---|
| Requested rate | 15,000/s | 15,000/s |
| Requests | 27,000,270 | 9,000,090 |
| Non-200 responses or transport errors | 0 | 0 |
| Overall p99 | 34.11 ms | 11.07 ms |
| Maximum sampled server RSS | 180.74 MiB | 8.29 MiB |
| Maximum sampled server FDs | 6,315 | 138 |
| Observation during 30-second recovery | 1,049 FDs remained | FDs returned to the baseline of 10 |
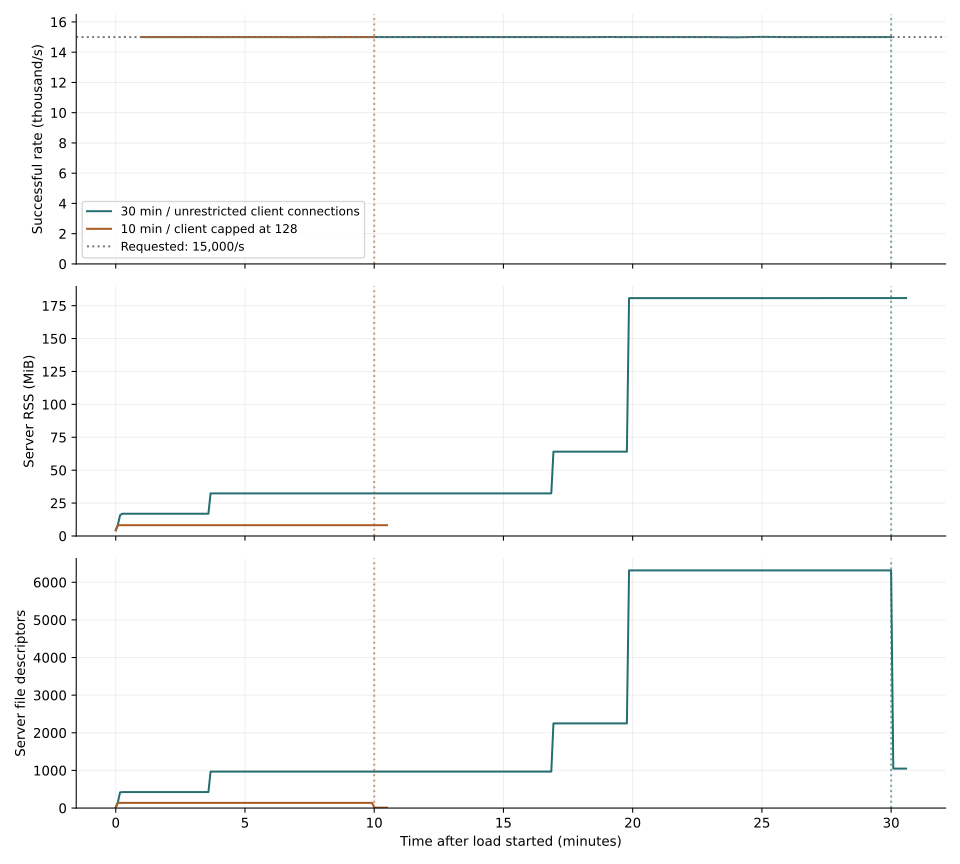
Memory increased at the same times as connection counts. The control lasted only 10 minutes, so it does not establish that a fixed connection count stays stable for 30 minutes or longer. We did not capture the types of the remaining FDs in the 30-minute run, and have not established whether connection teardown is faulty. RSS remaining high also does not, by itself, prove a memory leak.
In an additional 2-minute trial requesting 30,000/s, all 3,501,137 requests returned HTTP 200 and FDs reached 6,719. FDs returned to 10 after the load stopped and remained stable during 120 seconds of recovery. That trial records FD types and TCP states, but did not reproduce the remaining FDs from the 30-minute run. Their cause remains unresolved.
After the load stopped, we called /health every 0.5 seconds for 30 seconds and confirmed responses. The probe itself can briefly use one FD. The last sample in the 128-connection run shows 11 FDs, while other samples and independent TCP observations confirm recovery to 10.
128 is the measurement client's connection count. This PR does not add a 128-connection limit to Nagi. A small global server limit would restrict concurrency for many users or long requests.
Concurrent connection limits
| Requested connections | Initial HTTP success | Held connections reverified | RSS | FDs after disconnect |
|---|---|---|---|---|
| 1,000 | 1,000 | 1,000 | 28.49MiB | 10 |
| 10,000 | 10,000 | 10,000 | 246.18MiB | 10 |
| 15,000 | 15,000 | 15,000 | 366.97MiB | 10 |
| 16,000 | 16,000 | 16,000 | 391.07MiB | 10 |
| 16,400 | 16,374 | 16,374 | 400.16MiB | 10 |
| 18,000 | 16,374 | 16,374 | 400.12MiB | 10 |
After the initial response, we sent another HTTP request over every held connection. A successful TCP handshake alone does not count as a working connection.
When we requested 18,000 connections, 16,503 completed a TCP handshake, but only 16,374 returned the initial HTTP response and passed the held-connection verification.
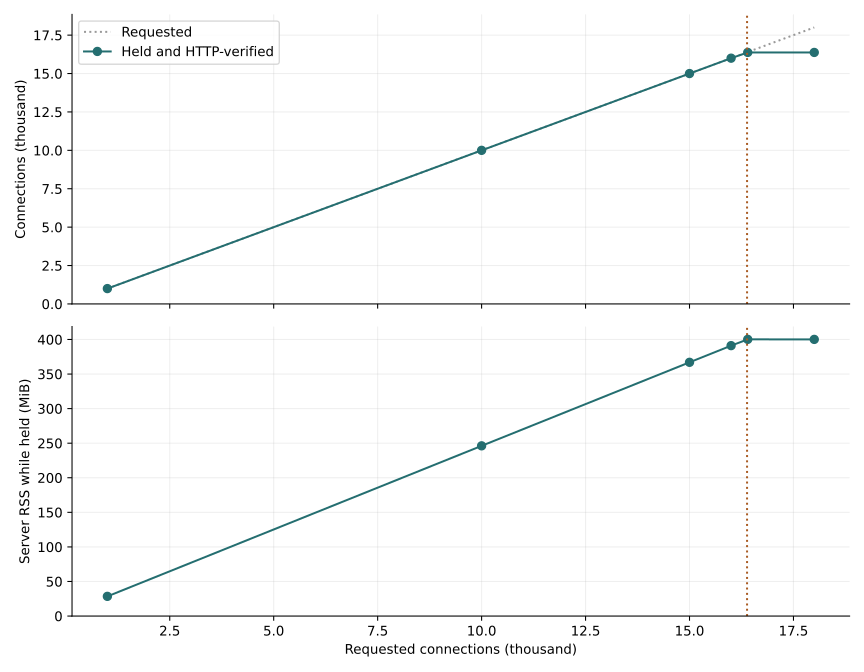
The OS FD limit was 16,384. The server also needs FDs for resources other than connections, so it runs out before this many clients can be accepted. This is an OS-dependent limit, not a fixed Nagi connection limit.
Idle, incomplete, and abruptly closed connections
| Condition | Observation over 120 seconds |
|---|---|
| Connect without sending a request | All 100 remained open |
| Stop while sending HTTP headers | All 100 remained open |
| Stop while sending the HTTP body | All 100 received 408 and closed |
| Leave keep-alive idle after a response | All 100 remained open |
| All clients disconnect normally | FDs returned to 10 during 5-second recovery |
| 200 abrupt disconnects (RST) after partial headers | FDs returned to 10 during 5-second recovery |
We observed 100 connections in each condition concurrently for 120 seconds. This is a small local behavior test, not a distributed attack or an attack on a public service.
Follow-up tests with the wait deadline
On October 1, 2026 (UTC), we compared Nagi 0.1.4 at 1c013868 with an implementation that adds a ten-second HTTP request-wait deadline. It uses unmodified Hyper 1.11.1. The results below come from these follow-up tests.
Connection recovery during regular traffic
We created 100 connections each for silence, partial headers, partial bodies, and unused keep-alive. Partial bodies received 408 under the existing two-second limit, and the remaining waiting connections also closed. FDs returned from 410 to 10. Connections were created sequentially before observation, so roughly ten seconds from the start of observation is not an exact lifetime for every connection. FDs also returned to 10 after 200 abrupt disconnects (RST).
In a separate test, we created 350 connections each for silence, partial headers, and unused keep-alive, totaling 1,050, while requesting 5,000 /health responses per second for 25 seconds.
| Item | Result |
|---|---|
| Requests actually sent | 124,977 |
| Non-200 responses or transport errors | 0 |
| Regular traffic p99 | 7.01ms |
| Observation when all waiting connections had closed | 11.28 seconds after load began |
| Server FDs | Initially 10, sampled maximum 1,092, 42 after recovery during load, finally 10 |
| Server RSS | Initially 4.34MiB, sampled maximum 20.08MiB, finally 17.73MiB |
The 42 FDs after recovery include 32 connections carrying regular traffic. RSS did not return to its initial value. This short test does not establish a memory leak or long-term stability. In the first attempt, the generator sent 124,997 requests and all returned 200, but the harness failed because it required exactly 125,000 arrivals. We corrected the assertion to check actual dispatched counts and repeated the test shown above. The first response aggregate is also retained.
Worker-count correction, October 2, 2026: The recovery test above set TOKIO_WORKER_THREADS=1, but Nagi reads NAGI_THREADS. Its default is four. The original test did not record the inherited setting, so its actual worker count is unknown. The smaller lifecycle test and throughput comparisons explicitly set NAGI_THREADS=1 through their shared helper. The original results and harness remain unchanged.
We repeated the load with the same modified 0.1.4 binary, recording NAGI_THREADS=1 and one actual Tokio worker thread. The test again used 1,050 waiting connections and 5,000 regular requests per second for 25 seconds.
| Item | Trial recording server TCP states | Trial recording both peers' TCP states |
|---|---|---|
| Requests actually sent | 124,997 | 125,000 |
| Non-200 responses or transport errors | 0 | 0 |
| Regular traffic p99 | 0.621ms | 0.610ms |
| Observation when all waiting connections had closed | 12.37 seconds after load began | 11.26 seconds after load began |
| Server FDs after load | 10 | 10 |
Two preceding attempts returned successful responses for all regular requests but failed validation because some clients did not observe connection closure. In one attempt, 25 silent clients had not observed closure even though server FDs had returned to 10. The cause is unresolved. The table shows the two later trials after adding reads to observe closure and TCP-state capture; it does not establish that every attempt observed all connections closing. TCP sampling and observation periods also differ, so these p99 values should not be used as a performance comparison with the earlier result.
At the end of both successful trials, 1,050 server-side connections were still in FIN_WAIT2, awaiting their peers' close, despite FD recovery. Reclaiming FDs does not mean every kernel TCP state has disappeared. Correction and repeat records include the attempts that failed validation.
Automated tests with a shorter deadline check that one-byte header progress does not reset the deadline, keep-alive can be reused within it, and long responses, slow response readers, streams, and upgraded WebSockets are not cut off by the request-wait deadline. These are not tests of large WebSocket fan-out or public-network capacity.
Effect on regular traffic
We alternated the implementations on the same host: before/after, after/before, then before/after. Each condition used 128 client connections and three five-second trials. The table shows the median throughput and median trial p99.
| Workload | Responses/s before | Responses/s after | Throughput change | p99 (before → after) | Errors |
|---|---|---|---|---|---|
| HTTP /health | 78,132 | 70,105 | −10.3% | 2.412 → 2.277ms | 0 |
| 4KiB JSON | 40,018 | 38,207 | −4.5% | 4.540 → 5.090ms | 0 |
The implementation that reclaims waiting connections has lower saturation throughput under these conditions. We have not profiled the cause. An earlier comparison that measured the baseline trials together also showed reductions of about 7.2% and 5.6%, respectively. The table uses the alternating-order repeat; raw data from both comparisons is retained. These brief trials on one host do not establish the same difference for every environment.
For the throughput comparisons and smaller lifecycle test, the server used one logical CPU and one worker; the load generator used two different logical CPUs. The assignments were server 0, clients 1,2, with HTTP/1.1 without TLS on loopback. OS FD limits were not raised. The 128 connections are a client-side test condition.
Raw follow-up data and script snapshots record hashes of the binaries, implementation, and harnesses. The original environments' source_commit identifies the checked-out base commit; also consult provenance.json to identify the modified implementation.
Reduce JSON response allocations
In 0.1.6, JSON success and error responses use a static Content-Type value. Comparing small JSON, 4KiB JSON, and 400/404/503 response construction in one process shows one fewer allocation and 16 fewer allocated bytes per response. Status, headers, and body bytes match. Network operations and body consumption are outside this allocation measurement.
Both versions keep the current ten-second connection wait deadline. Five alternating baseline/candidate pairs per endpoint use 128 client connections for ten seconds, one server CPU with NAGI_THREADS=1, and two separate load-generator CPUs.
| Operation | Baseline responses/s | Candidate responses/s | Change in medians | p99 (before → after) | Errors |
|---|---|---|---|---|---|
| /health | 71,069 | 70,186 | −1.2% | 2.721 → 2.859ms | 0 |
| Small JSON | 65,438 | 66,191 | +1.2% | 2.947 → 3.127ms | 0 |
| 4KiB JSON | 38,632 | 38,844 | +0.5% | 3.911 → 4.233ms | 0 |
Paired differences varied in both directions, including the unchanged /health endpoint. These trials do not establish a throughput improvement. The directly measured benefit is fewer allocations during response construction. All 30 trials and reproduction steps are retained.
Connection management and DoS protection
The current serve has a 1 MiB HTTP body limit and a 2-second handler timeout. It binds only to 127.0.0.1 by default. These controls do not bound every connection's lifetime or the traffic reaching a public deployment.
The implementation adds no fixed connection cap. Silent connections and incomplete header sends now have a deadline.
The initial measurements at c602abb predate connection deadlines. The server now uses a shared ten-second deadline for initial silence, incomplete headers, and the wait from a completed response until the next complete headers. Keeping Hyper unmodified means unused keep-alive does not have a separate 60-second deadline. The deadline is configurable through an environment variable and excludes active responses, streams, and upgraded WebSockets. See HTTP for configuration.
| Proposed control | Intended effect | Decision still needed |
|---|---|---|
| Investigate and fix connection teardown | Release resources after disconnects | Reproduce and identify the remaining FDs from the 30-minute run |
| Header and HTTP wait deadline | Bound silent, partial-header, and unused connections | Shared ten-second deadline implemented; verify deployment settings and reconnection costs |
| Body receive and work admission controls | Bound stalled uploads and queued work | Interaction with existing timeouts and queue capacity |
| Fronting proxy or CDN | Filter excessive traffic to public services | Deployment, traffic and connection budgets, and source policies |
Deployment limits are needed separately from this wait deadline. If a DDoS attack fills the network link, controls inside Nagi cannot resolve that saturation; upstream protection is also needed.
Environment and reproduction
| Item | Condition |
|---|---|
| Nagi / Rust | 0.1.2 / 1.98.1 |
| OS | Linux x86_64 |
| CPU | AMD EPYC 7763 64-Core Processor |
| CPU allocation | cgroup quota of 4 CPUs; 5 logical CPUs available |
| Memory limit | cgroup 16 GiB |
| Server / generator | CPU 0 / CPUs 2,3 |
| Server FD limit | Soft and hard limits both 16,384 |
| HTTP / SQLite | HTTP/1.1 without TLS / in-memory database |
| Build | release, opt-level=3, LTO disabled |
The server used one logical CPU and one executor worker. The generator used two different logical CPUs. SQLite has a dedicated database worker. OS FD limits were not raised. Every short trial started a fresh server and database, with warmup outside the measured interval.
Use Linux/cgroup v2, Python 3.12, Rust, taskset, and Vegeta v12.13.0. The wrk test also needs wrk 4.2.0. To reproduce the same language implementation, build c602abb and copy this PR's measurement scripts into that checkout.
cargo build --locked --release -p nagic
NAGI_ROOT="$PWD" NAGI_NATIVE_TARGET_DIR="$PWD/native-target" \
  ./target/release/nagic build examples/crud.nagi --out build/crud

python scripts/http_capacity.py --phase limits --duration 8 --repeats 3 \
  --vegeta /path/to/vegeta --out build/http-limits
python scripts/http_capacity.py --phase soak --soak-seconds 1800 --soak-rate 15000 \
  --vegeta /path/to/vegeta --out build/http-soak
python scripts/http_saturation.py --wrk /path/to/wrk --out build/http-saturation
python scripts/tcp_capacity.py --out build/tcp-capacity
python scripts/http_connection_lifecycle.py --out build/connection-lifecycle
Default CPU IDs are 0 for the server and 2,3 for the client. Use --server-cpus and --client-cpus to choose disjoint available IDs if necessary. The target is fixed to 127.0.0.1:8080. Existing results are never overwritten.
Raw data, conditions, and measured script snapshots are included. Regenerate the figures while retaining the measurements. Plotting needs matplotlib; measurement does not.
python scripts/http_capacity_report.py \
  --data benchmarks/results/http-capacity-2026-10-01 \
  --assets website/assets/http-capacity
TLS, a real network link, sustained writes to persistent SQLite, WebSocket fan-out, and continuous operation over 24 hours or longer remain unmeasured. The previous measurements used different clients and CPU allocations, so these numbers are not a direct before-and-after comparison.